When you buy through links on our site, we may earn an affiliate commission. As an Amazon Associate I earn from qualifying purchases.

Awesome Visualizations

Graphing Wikipedia

Graphing Wikipedia

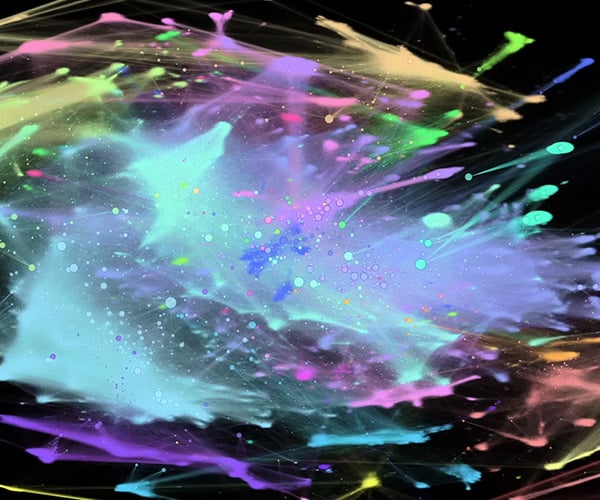
This might look like abstract art, but it’s based entirely on data from Wikipedia. Developer adumb wrote code to graph the relationships between content on the crowdsourced encyclopedia. The image maps over 6.3 million Wikipedia articles and 195 million links between them. adumb explains some interesting things he observed along the way.

Polyrhythms Visualized in a Circle

Polyrhythms Visualized in a Circle

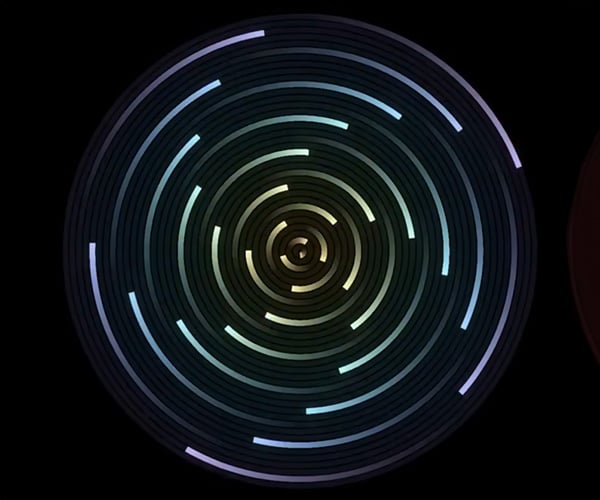
Do you like music and math? Then you’ll dig polyrhythms. JLChnToZ (Vistanz) created this captivating video that displays a representation of these complex and often hypnotic sounds in concentric circles. For maximum effect, put the video on full screen, dim the lights, and crank up the volume.

ADVERTISEMENT

Home | About | Suggest | Contact | Team | Links | Privacy | Disclosure
Advertise | Facebook | Twitter | Pinterest | Sites We Like

Awesome Stuff: The Awesomer | Cool Cars: 95Octane
Site Design & Content © 2008-2024 Awesomer Media / The Awesomer™