When you buy through links on our site, we may earn an affiliate commission. As an Amazon Associate I earn from qualifying purchases.

Awesome Graphs

Graphing Wikipedia

Graphing Wikipedia

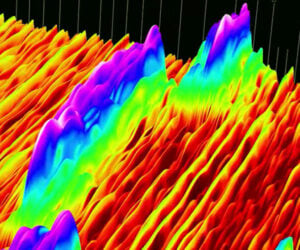
This might look like abstract art, but it’s based entirely on data from Wikipedia. Developer adumb wrote code to graph the relationships between content on the crowdsourced encyclopedia. The image maps over 6.3 million Wikipedia articles and 195 million links between them. adumb explains some interesting things he observed along the way.

Grid Pattern Sticky Notes

Grid Pattern Sticky Notes
Buy

Office supply and organization shop MochiThings sells these unique sticky notes which have grid patterns printed on them. They’re ideal for doodling technical drawings, graphs, floorplans, and wireframes. They come in eight different patterns, and are sold individually, or in two collections of four note pads.

Advertisement

Visualizing Modem Sounds

Visualizing Modem Sounds

The electronic squeals of dial-up modems were truly unpleasant, but also brought us our earliest internet memories. If you’ve ever wondered what those sounds might look like on a graph, you’re in luck. Scotty H generated a spectrogram that shows the frequencies being generated during a moden’s handshake phase.

Graphing YouTube’s Biggest Videos

Graphing YouTube’s Biggest Videos

Abacaba used a combination of line graphs and sounds to represent the history of YouTube’s most popular viral videos from Charlie Bit my Finger to Gangnam Style to Despacito. Frankly, we’re not sure the sounds added much value, but the moving chart was fascinating.

ADVERTISEMENT

Home | About | Suggest | Contact | Team | Links | Privacy | Disclosure
Advertise | Facebook | Twitter | Pinterest | Sites We Like

Awesome Stuff: The Awesomer | Cool Cars: 95Octane
Site Design & Content © 2008-2024 Awesomer Media / The Awesomer™