When you buy through links on our site, we may earn an affiliate commission. As an Amazon Associate I earn from qualifying purchases.

Awesome Infographics

Searches 2010 to 2020 by State

Searches 2010 to 2020 by State

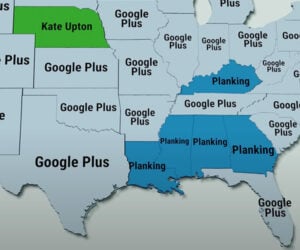
If you can believe it, there was a time when “Google Plus” was the most popular search phrase in the U.S. V1 Analytics‘ infographic video looks back at Google search data from 2010 to the beginning of 2020, showing off the top trending search phrases for each state, from “Dr. Oz” to “Here Comes Honey Boo Boo.”

The Rise and Fall of Blockbuster

The Rise and Fall of Blockbuster

’80s and ’90s kids surely remember how Blockbuster dominated the home video rental landscape before Netflix and streaming took over. This animated infographic from V1 Analytics shows the rise and fall of the business as its stores popped up and vanished across the nation between 1986 and 2019.

Advertisement

Most Popular TV Shows 1951-2019

Most Popular TV Shows 1951-2019

Remember when Home Improvement was the biggest show on TV? Or Roseanne? Data Broz put together this motion infographic which recaps the shifting interests of the U.S. TV viewing public over nearly 70 years. We had no idea that The Beverly Hillbillies was so wildly popular. (Pro tip: play at 2x speed for faster viewing.)

Relative Rotations of Planets

Relative Rotations of Planets

Dr. James O’Donoghue posts all kinds of informative motion graphics on his YouTube channel. Here, he stacked slices of the Solar System’s planets to show how their rotational speeds vary. You can view it flat, or projected onto a sphere. He’s also got a version that accounts for for differences in rotational direction.

Asteroid Size Comparison

Asteroid Size Comparison

The earth gets pelted by small meteorites on a regular basis, but bigger bits of asteroids breaking through are far less common. MetaBallStudios does their best to give us a sense just how big some of these space rocks can be, standing them besides the skyscrapers of NYC for comparison.

Why We Have Leap Years

Why We Have Leap Years

Ever wonder why we add a day to the end of every fourth February? Well, as it turns out, the Earth orbits the sun every 365.242 days, so we get off by about a quarter day every year. Dr. James O’Donoghue provides a concise graphical explanation of this time tweak we do to make things right, and what would happen without leap years.

Odds of Superpowers

Odds of Superpowers

Reigarw Comparisons already showed us the chances of winning big and how we might perish. Now they’re back to explore just how unlikely it is that you’d possess one of the many real-world “superpowers” that our genes can bestow us with. Now imagine how slim the odds are of having multiple mutations.

Advertisement

Rare Substance Probabilities

Rare Substance Probabilities

Ever wonder what the chances were of stumbling upon naturally-occurring gold or platinum? Reigarw Comparisons returns with another infographic video to explore the probabilities of finding a randomly occurring atom of substances on Earth, from the wildly prolific oxygen, to the incredibly rare Element 118.

History of the Earth

History of the Earth

Over its 4-ish billion year history, the Earth has seen some dramatic changes. Algol does a great job conveying some of the milestones of our planet’s development through this animated infographic, which shows changes in the Earth’s average temperature, atmospheric composition, and day length throughout its lifetime.

What the Earth’s Crust Is Made Of

What the Earth’s Crust Is Made Of

Do you know what’s beneath your feet? Go deeper than the dirt and the rocks and the water, and you’ll eventually get to the Earth’s crust. This great infographic video from Dr James O’Donoghue (@physicsJ) and Dr. Christine Houser (@seismodoc) illustrates the materials comprising the crust, as well as their proportions.

Death Probability Comparison

Death Probability Comparison

Every wonder how your time here on Earth might end? Well the guys at Reigarw Comparisons decided to put together a little chart to give us some idea of the likelihoods of some of the many ways in which we could each perish. We wish you each something quick and painless.

Rocket Size Comparison

Rocket Size Comparison

After offering up a size shootout between Star Wars spacecraft, MetaBallStudios decided to do the same with some real world rockets and spaceships, from the diminutive 42 foot Black Arrow to the ginormous Saturn V, which was over 360 feet tall. They should have included some model rockets for comparison.

Advertisement

If You Never Pooped Again

If You Never Pooped Again

Despite people’s discomfort with the subject, pooping is something we all do. For shits and giggles, The Infographics Show decided to answer the hypothetical question of what kinds of horrors would happen if you never dropped the kids off at the pool again.

Most Popular Websites: 1996-2019

Most Popular Websites: 1996-2019

Remember when Excite!, Lycos, and Geocities were a thing? In one of its more fascinating moving bar charts, Data Is Beautiful looks back at the history of the Internet over more than two decades, tracking the biggest websites based on monthly visits. Yes, there was a time before Google, Facebook, and YouTube.

Programming Languages 1965-2019

Programming Languages 1965-2019

If you look back at how computers have been programmed over the years, the languages used have shuffled around quite a bit. From the early days of Fortran, to the rise of BASIC, to the explosion of Java, PHP, and Python, Data Is Beautiful charted the changing popularity of each major language over more than 50 years.

Star Size Comparison

Star Size Comparison

Don’t feel small and insignificant enough today? Here, watch this. 3D graphics expert Álvaro Gracia Montoya of MetaBallStudio puts the size of the Earth and our Sun into perspective alongside some of the other stars and planets in the universe.

Star Wars Size Comparison

Star Wars Size Comparison

As we’ve learned before, Alvaro Gracia Montoya of MetaBallStudios loves to compare the sizes of things. This time out, he shows us the vast differences in size of everything from a lightsaber to Yoda, to Starkiller Base, to Yavin Prime… and everything in between.

The 50 State Nightmares

The 50 State Nightmares

Neil Cicierega’s amusing video pokes fun at the numerous infographics and clips listing unique state attributes. Here, he runs down the strange and disturbing dreams that each of America’s 50 states experiences, in all likelihood due to some sort of chemical in the water.

Marvel Superhero Size Chart

Marvel Superhero Size Chart

With Ant-Man and the Wasp hitting theaters, Marvel figured it would be fun to offer up a size comparison of the flexibly-sized hero with some of their other characters. We had never heard of Simon “Throg” Walterson, but we so need a Pet Avengers movie now.

Star Wars Super Graphic

Star Wars Super Graphic
Buy

A spectacularly fun book for any Star Wars fan, graphic designer Tim Leong’s lighthearted paperback is packed with infographics, facts, and figures from what each lightsaber color means, to the heights of popular characters, to the Jedi High Council seating chart.

Toxicity Comparison

Toxicity Comparison

Size comparison guru Reigarw Comparisons looks at the lethality of a variety of substances, and tells us how much of each one we’d have to take in before we dropped dead. We’re not sure how many cats it would take to kill you though.

Compound Interest

Compound Interest

Chemistry teacher Andy Brunning’s website is packed with amazing scientific infographics which educate and entertain. The charts explain everything from the composition of spirits, foods, and products, to the origins of element names. Be sure to check out Andy’s book too!

Common Mythconceptions

Common Mythconceptions

Information is Beautiful compiled some of the most googled falsehoods as well as the actual facts behind them. The image on the site is a partial chart; the art print and the PDF contain 26 more items. Sources here.

ADVERTISEMENT

Home | About | Suggest | Contact | Team | Links | Privacy | Disclosure
Advertise | Facebook | Twitter | Pinterest | Sites We Like

Awesome Stuff: The Awesomer | Cool Cars: 95Octane
Site Design & Content © 2008-2024 Awesomer Media / The Awesomer™